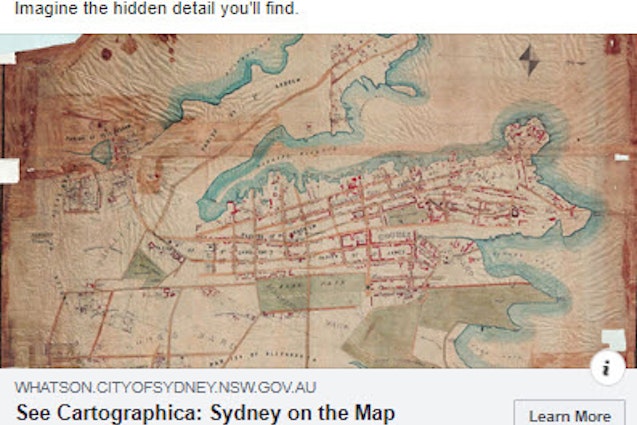
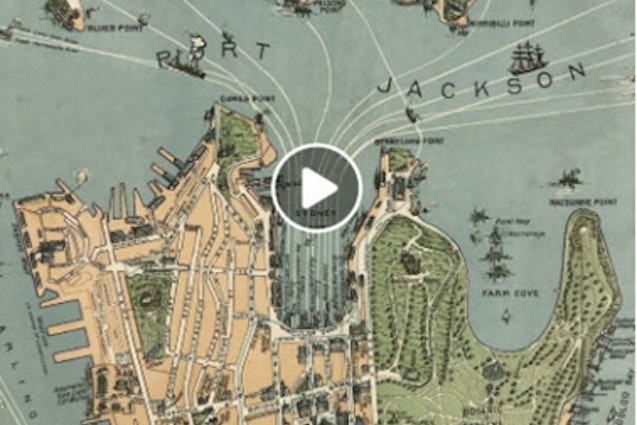
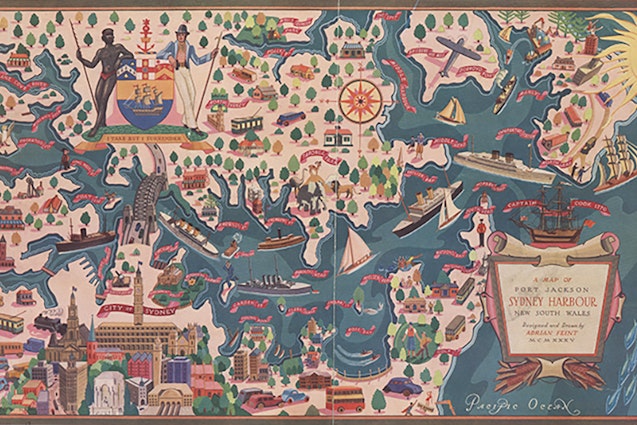
Cartographica: Sydney on the map
Cartographica was the first exhibition of its kind produced by the City. Hosted at Customs House, it exhibited of all kinds of maps of Sydney.
The exhbition was a fascinating account of the factors that have shaped Sydney, highlighting some of the many different ways mapmakers have documented the evolution of our city.
Our objectives
We were tasked with creating awareness of the exhibition and its unique elements broadly across the community.
- Promote the exhibition
- Increase brand equity through imaginative use of imagery and communication
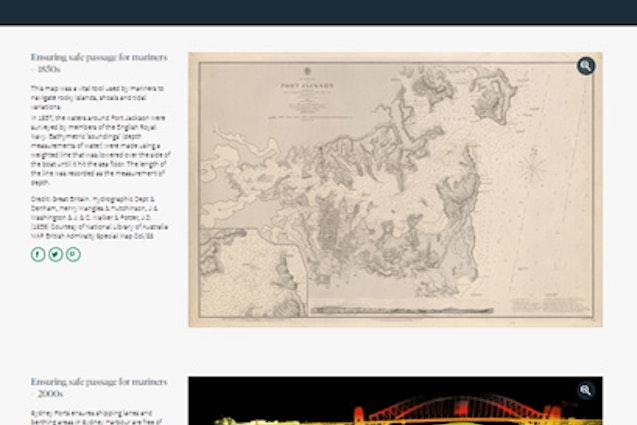
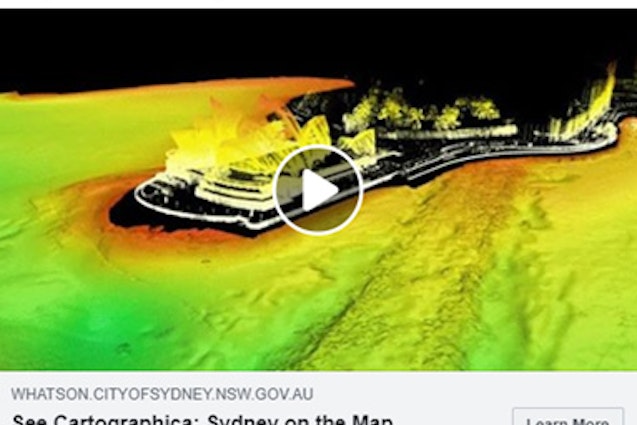
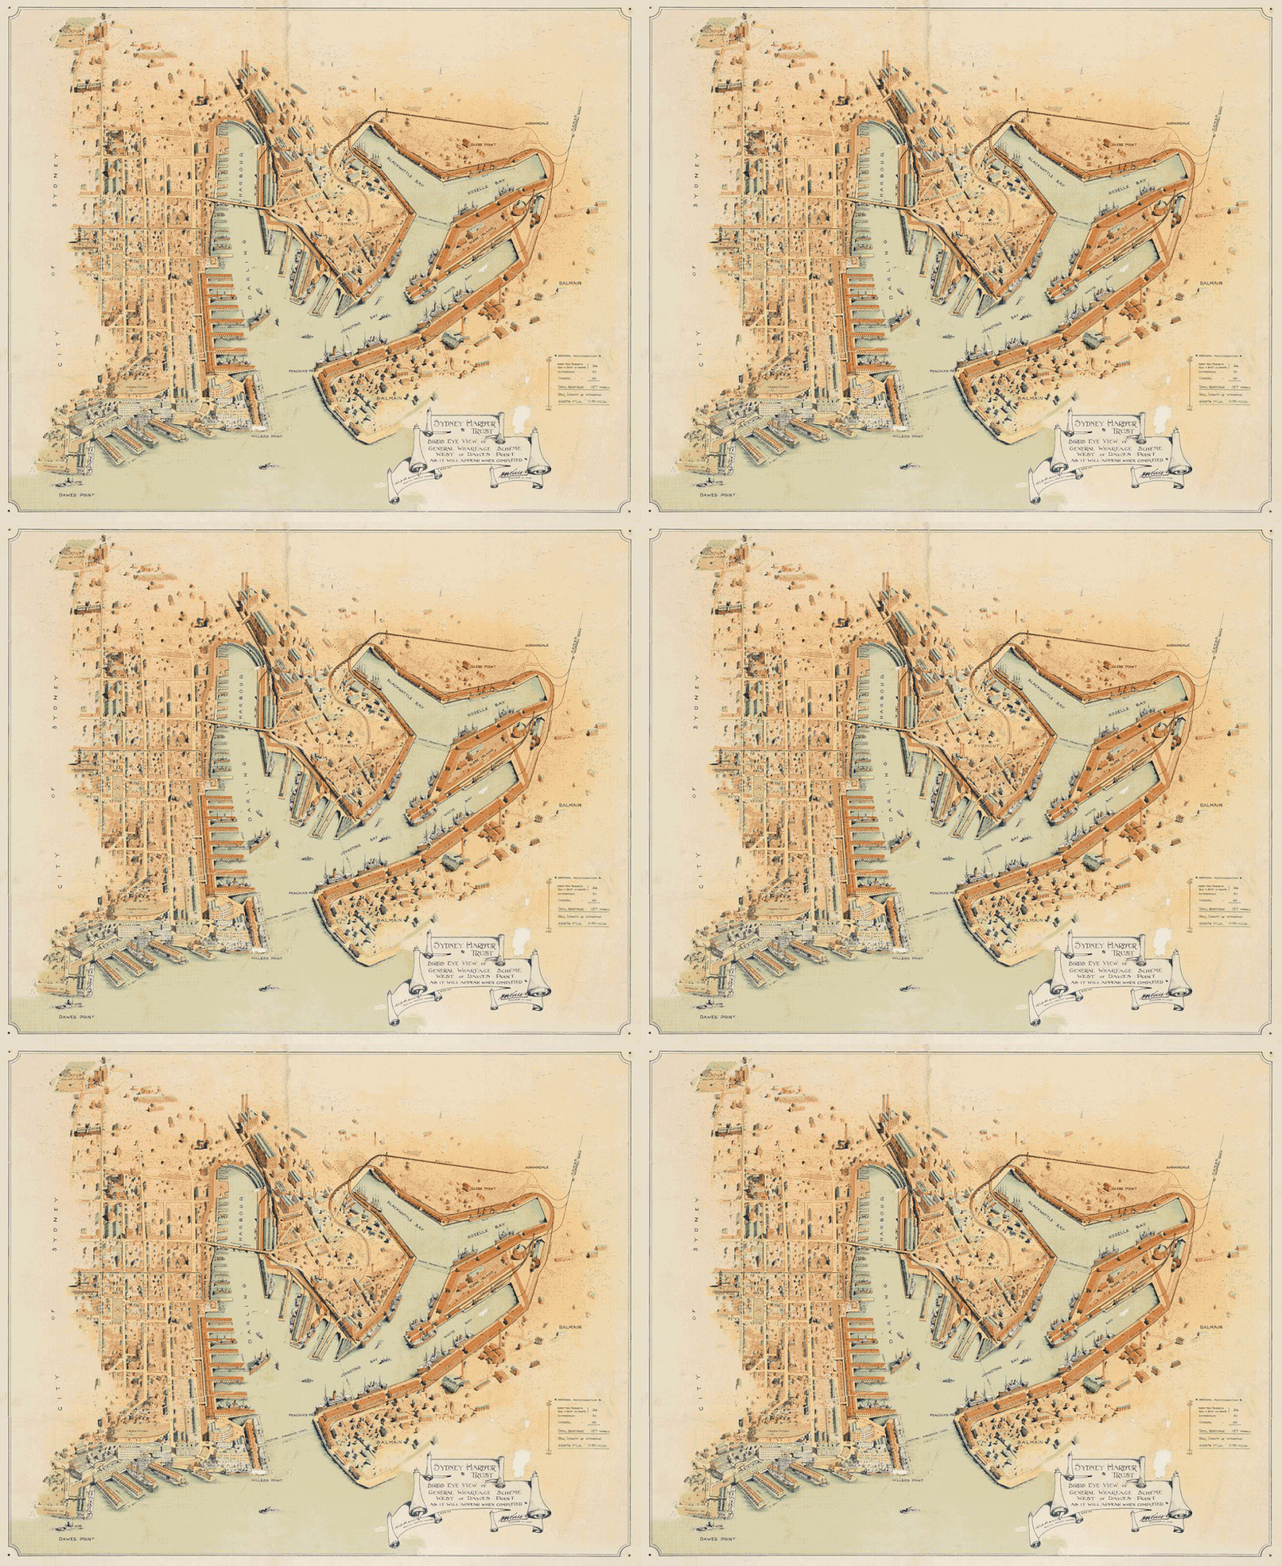
- Raise awareness of the different facets of mapping Sydney, from the earliest colonial maps to recent 3D digital mapping of the harbour
Who we targeted
- Sydney metro residents
- Visitors to Sydney (during the exhibition period)
- People who have an interest in history or maps
Our approach
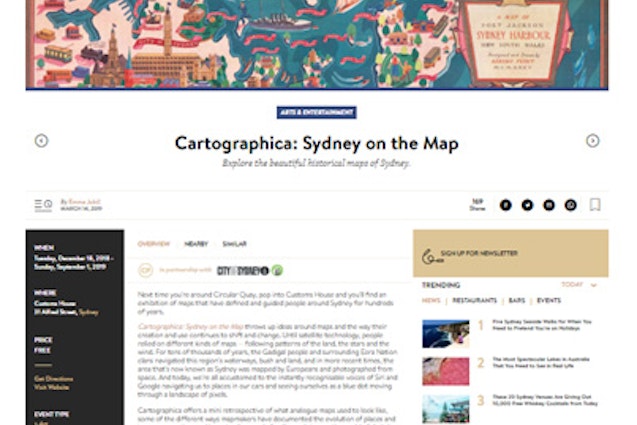
To raise awareness for the exhibition we used a mix of content marketing, social media advertising, earned media (publicity), and email marketing tactics.
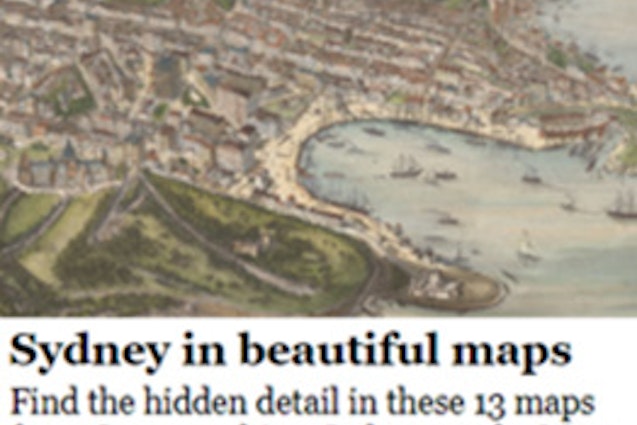
To help stimulate interest and intrigue, weave a story and reveal a surprising breadth of map types, a selection of maps was chosen as hero content. Some of these maps were animated with motion graphics. These animations were the key driver of curiosity across native advertising, City of Sydney News, publicity and e-newsletters.
Facebook and native advertising incorporated A/B message testing and presented variations to different audience segments. For example, for the Facebook advertising 3 audience segments were created and targeted: 1) people interested in history 2) people interested in maps (such as cartographers, urban designers and architects) and 3) geeks (people into Wired magazine, Myth Busters, model making, medieval role playing and more – this audience performed really well!)
Highlights
What's On website
total unique page views
Facebook advertising page views
6 - 13 June 2019
